Home >blog > data visualisation top 5 techniques and tools

Data Visualisation: Top 5 Techniques and Tools
Published On: 02 Feb 2024
Last Updated: 05 Feb 2024
Views: 1.3L
Table of Contents
Congratulations!
After spending hours cleaning, sorting, and categorising data - you found some valuable insights. But, here is a catch: How do you make sense of this huge pile of numbers and facts?
Enters- Data Visualisation.
Put simply, data visualisation is a powerful tool for transforming complex data into clear, understandable visuals. With visualisation, you can convert your findings into engaging charts, maps, and graphs, making them easily comprehensible for all.
Whether you are a pro in the data field or a beginner, data visualisation makes it easier to communicate your findings effectively.
What is Data Visualisation?
Each day we generate approximately 328.77 million terabytes of data (source: explodingtopics.com). But until you clean, filter, and sort the information, you cannot extract the real value. This is where data visualisation comes in handy.Data visualisation simply implies representing data visually. Instead of staring at columns of numbers or endless rows of data, you convert your findings into charts, graphs, and diagrams. It's like turning data into a story that's easier to understand. Data visualisation concepts make complex information accessible. With these techniques, any organisation can spot patterns in a matter of seconds and make informed decisions.
Top 5 Types of Data Visualisation Techniques
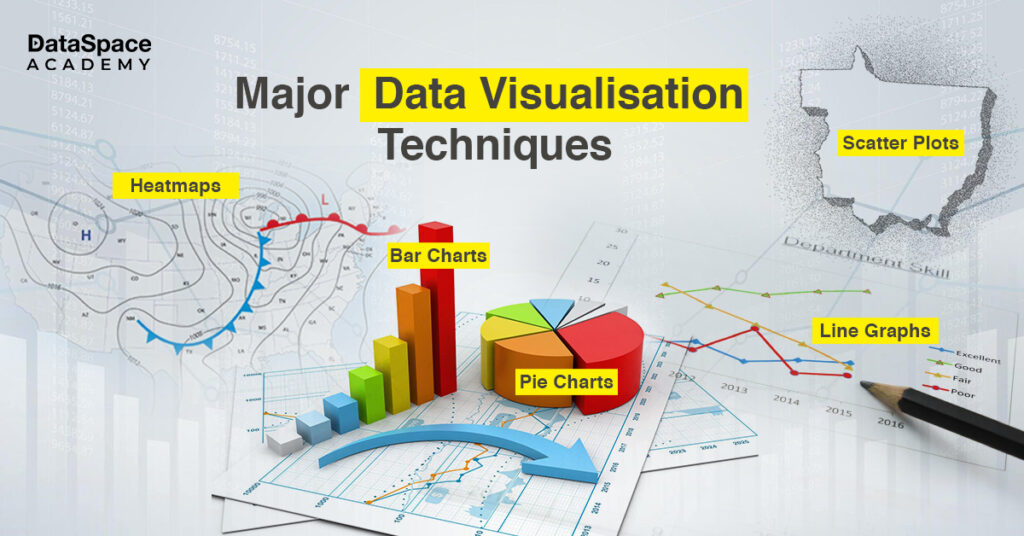
 When it comes to visualising data effectively, there are several techniques at your disposal. Here are the different types of visualisation techniques frequently used by analysts:
1. Bar Charts
Think of a bar chart as a stack of bars that represent data points. They are excellent for comparing different categories or showing changes over time. For instance, you might use a bar chart to display monthly sales figures for your business.2. Line Graph
Line graphs are like bar charts, but they connect data points with lines. Ideal for tracking trends and changes over time, these graphs are perfect for displaying stock market fluctuations or temperature changes throughout the year.3. Pie Charts
Pie charts are among the most popular data visualisation technologies. This chart divides a whole pie into slices and each slice represents a portion of the total. They are useful for displaying parts of a whole, like the distribution of expenses in a budget or the sources of traffic to a website.4. Scatter Plots
Scatter plots are among the most used data visualisation techniques in data mining. It uses points on a grid to show the relationship between two sets of data. They're great for identifying correlations or outliers, like comparing the height and weight of individuals to see if there's a relationship.5. Heatmaps
These are the most commonly used data visualisation techniques in business analytics. In this Colour is the key element in a heatmap; different colours are used to represent varying kinds of data values on a grid. These maps are especially helpful in representing large datasets, like website user activity.Hotter colours (reds and oranges) indicate higher values, while cooler colours (blues and greens) represent lower values.
What Are The 4 Data Visualisation Tools?
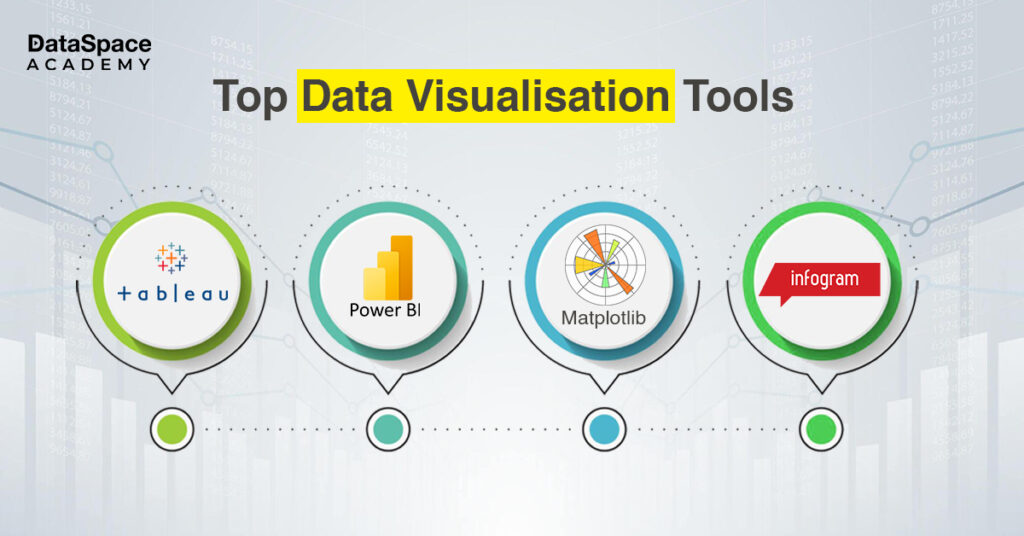
 Here are four popular options for creating the most effective data visualisation:
- Tableau: Tableau is a versatile tool known for its user-friendly interface and powerful data visualisation capabilities. It's widely used across industries for creating interactive and shareable dashboards.
- Microsoft Power BI: Microsoft Power BI is an interactive data visualisation software that seamlessly integrates with other Microsoft applications. Data visualisation techniques in Power BI enable you to run data discovery, data preparation, and interactive dashboards. Power BI is the most popular data analytics tools today. Join our business analytics training program to learn Power BI and other analytics tools.
- Matplotlib: It is a Python library used for data visualisation. Matplotlib’s data visualisation techniques in Python help you generate simple visuals based on the data.
- Infogram: It is a fully-featured drag-and-drop visualisation tool, making it easier for even non-designers to create effective visuals.
Conclusion
Data visualisation is crucial for data analysis. It helps you understand complex data, identify trends, and communicate insights effectively. With approximately 328.77 million terabytes of data generated daily, you need data visualisation techniques and tools to uncover actionable insights from them. DataSpace Academy’s Data Analytics Certification Course has a dedicated module on data visualisation. Here you learn about PowerBI, Tableau (Public Version), and Data Storytelling. Do you want to know more about data visualisation? Check out our blog on Data Visualisation and its Overview, Types, and advantages.
Get In touch
Talk to our Career Experts


