Matplotlib for beginners: Your one-stop shop for professional data visualisation
Last Updated : 01 Mar, 2024
 1.25L
1.25L

Introduction
Talk about the most popular data visualisation libraries in Python and Matplotlib certainly secures a top berth. A professionals’ standard Python stack, the tool stands out with its state-of-the-art static, animated, and interactive visualisations. Whether it’s about generating basic plots, customising visualisations, creating animations, or crafting interactive interfaces, Matplotlib covers all these. This versatile library houses all the major tools to meet a wide range of data visualisation needs. Its flexibility, extensive documentation, and active community support make it an indispensable tool for professionals. Matplotlib in Python is largely used across various domains, including data science, research, engineering, and finance to name a few.
Businesses are on a hunt for Matplotlib-qualified Python developers who can analyse, interpret, and visualise data to help them with informed decisions. And, they are also flexible to offer a lucrative package for Matplotlib experts. If you also want to land a high-paying role as a Matplotlib-specialist, dive straight into the blog below for a comprehensive starter guide.
Features of Matplotlib
Matplotlib is a popular Python 2D plotting library offering various tools for generating diverse plots and customisation options. The tool also supports other multiple plot types, added to its in-built ones. These star features make matplotlib library in python a staple for conducting comprehensive scientific research, data analysis, and advanced visual data interpretation.

Some striking features of Matplotlib are as follows:
- Open-source tool
- Free for commercial use
- Interactive cross-platform that helps to create publication-quality figures, and static vector graphics
- Offers a diverse range of toolkits for visualising data like pyplot, axes_grid1, mplot3d, scale, image, and widgets
- Allows highly customizable plots and charts with precise control over elements such as colours, fonts, and styles.
- Cross-platform compatibility
- Facilitates seamless integration with other Python libraries such as NumPy and Pandas
- Matplotlib library offers both script-based and object-oriented interfaces, providing flexibility in coding styles and approaches
How does it work?
Excited to get started? Take your Python and data analytic skills to the next level with our simple matplotlib tutorial below. So, here you go:
Step 1: Importing Matplotlib in Python
-
Start by importing matplotlib.pyplot.
Why to go for matplotlib pyplot library in python?
Because pyplot is a widely implemented interface for Matplotlib to create interactive plots. For easier application, pyplot is usually imported as plt.
Step 2: Creating plots in Matplotlib
-
One can implement 2 steps to create plots in Matplotlib:
i) matplotlib.pyplot.plot(): This command is used to create simple plots (e.g. x and y).
ii) matplotlib.pyplot.XX: This command is usually used to create complex plots.
iii) plt.subplots(): Used to create multiple plots.
Note: The first two commands are created by using this base command import -matplotlib.pyplot. You have to write pyplot as “plt”.
Step 3: Create empty graph in Matplotlib
-
You can use the following 3 commands to create empty graph in Matplotlib:
i) plt.plot()
ii) plt.plot();
iii) plt.show()
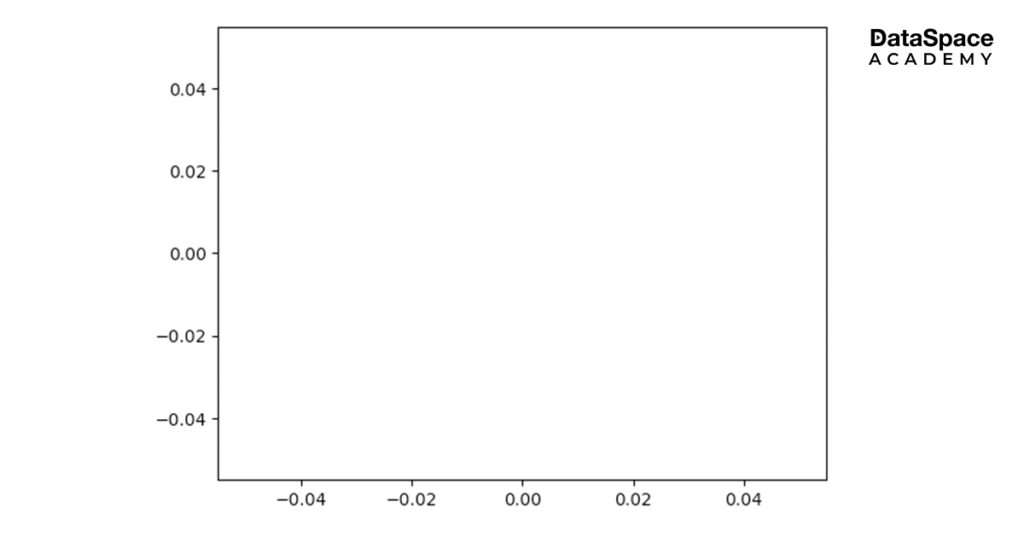
Step 4: To create data in Matplotlib, use the following command
-
plt.plot([1, 2, 3, 4]);
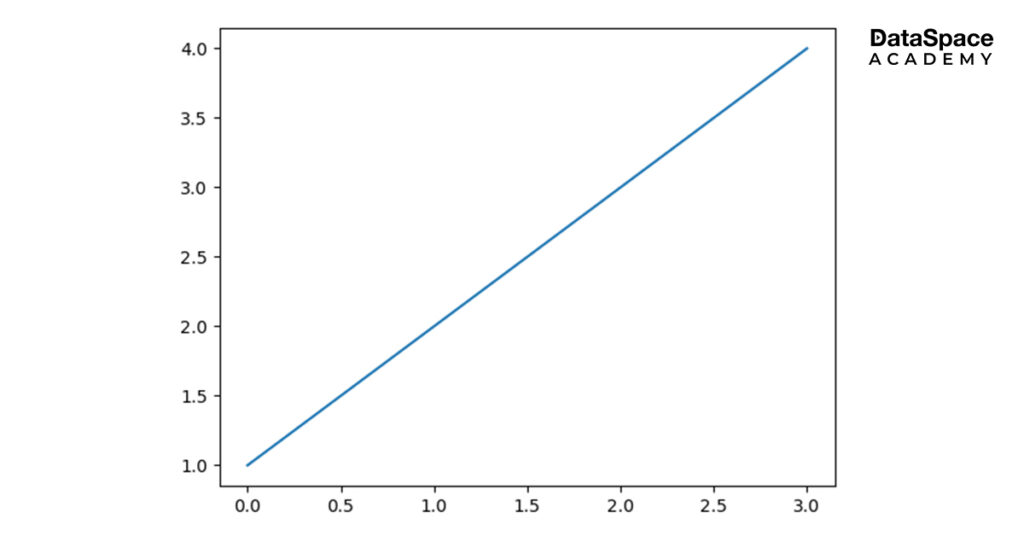
Now let’s dive quickly into the vocabulary of Matplotlib terminology:
i) A figure often used as a shortened form “fig”. It is the base canvas for all matplotlib plots. For example, to deliver the final image in Matplotlib, use the following command: fig = plt.figure().
ii) The term Axes is for an individual plot, which is shortened to ax. For example, ax = fig.add_subplot().
iii) The term Axis is to denote x (horizontal), y (vertical), and z (depth)
Step 5: Matplotlib enables you (users) to customise plots with a few more built-in methods.
-
fig = plt.figure()
# Creating subplot/axes
ax = fig.add_subplot(111)
# Setting axes/plot title
ax.set_title(‘An Axes Title’)
# Setting X-axis and Y-axis limits
ax.set_xlim([0.5, 4.5])
ax.set_ylim([-3, 7])
# Setting X-axis and Y-axis labels
ax.set_ylabel(‘Y-Axis Label’)
ax.set_xlabel(‘X-Axis Label’)
# Showing the plot
plt.show()
Supercharge your Python programming skills by enrolling in thye industry-leading python programming course from a reputed academy.
Use Cases
This versatile library can be used for a wide range of visualisation applications. Presenting some of the use cases of Matplotlib:
- Exploratory Data Analysis (EDA)
The tool is widely used for EDA in data analysis for visualising datasets through histograms, scatter plots, and box plots. - Interpretation of statistical results
Matplotlib is a favourite for creating visualisations for statistical results such as probability distributions, confidence intervals, and regression analysis. These visualisations help interpret statistical models and communication results more effectively. - Plotting functions for scientific disciplines
The popular data visualisation tool enables a wide range of plotting functions as contour plots, surface plots, and other types of visualisations. These visualisations are commonly used in physics, biology, chemistry, and other scientific disciplines. - Time-series Data
Matplotlib comes in handy while visualising time-series data, like plotting stock prices, weather patterns, sensor data, and other time-dependent datasets. - Geospatial visualisation
Matplotlib helps to create geographical and thematic maps by integrating with different libraries like Basemap and Cartopy.
Benefits of Matplotlib
Matplotlib extends a wealth of advantages for professional data interpretation and graphical representation. Listing some of the best aspects of Matplotlib that have made it a favourite aming data analysts:
- Simplifies data interpretation:
Matplotlib allows users to create precise plots by interpreting huge amounts of data. These accurate data plots help to simplify data patterns and trends for easier comprehension. - Versatile offerings for data representation:
Matplotlib users enjoy the flexibility to create data presentations in various forms of visualisation mediums like bar charts, graphs, scatter plots, and so on. You can count on Matplotlib to find a compatible visualisation according to your project needs. - Compatible with different platforms:
Matplotlib’s data visualisation techniques run smoothly across different platforms in Windows, Mac OS, or Linux. - User-friendly
Matplotlib is considered as one of the most easy-to-use and efficient data analysis and visualisation platforms. A basic know-how of Python would suffice to operate the library like a pro.
Limitations
- Complex Learning Curve:
To begin with, Matplotlib’s API can be overwhelming for beginners, leading to a steep learning curve. This mainly happens while customising plots or creating complex visualisations. - Limited Interactive Features:
While it supports basic interactive features like zooming and panning, creating highly interactive plots may require additional effort or integration with other libraries. - Performance Issues with Large Datasets:
Users might experience performance issues when plotting large datasets, especially in interactive mode. - Limited 3D Visualisation Support:
Matplotlib’s 3D plotting capabilities (mplot3d toolkit) are somewhat limited. Sometimes, it might require additional effort – also, the 3D plotting features might not be easily compatible with other tools. - Non-native GUI Integration:
Users may encounter compatibility issues or limitations when integrating Matplotlib plots into GUI applications.
Conclusion
Matplotlib is the cornerstone of Python’s data visualisation ecosystem, offering a versatile toolkit for creating insightful and publication-ready plots. While it might present a steep learning curve for beginners, the stack offers immense flexibility and extensive documentation privileges. The tool also boasts vast community support which altogether makes it an indispensable data visualisation tool across various domains.
 1.25L
1.25L

